Temperature graphs 1999/2000
This data came from two sources. The Mertz readings that I recorded in my journal were from my Remington clock radio. This small radio was located in my room on or near my desk. The Philadelphia readings are from the Franklin Institute and are © 1995 – 2003, The Franklin Institute Science Museum, All rights reserved.
The averages are a five-day moving average. In the cases where the time ranges do not have a history of five temperatures, the average consists of the available prior temperature points.

During the beginning of autumn, indoor and outdoor temperatures commingled in a somewhat comfortable range.

As the indoor temperature stabilized, the exterior reading became more variable and colder.

Below freezing temperatures in January soon gave way to a warming trend that plateaued in mid-February. Warmer weather then continued into March.
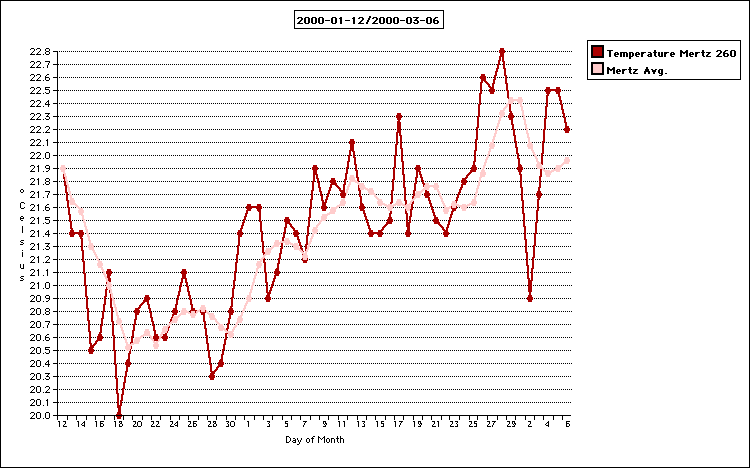
Indoor daily temperatures generally increased during the winter although they remained near room temperature.
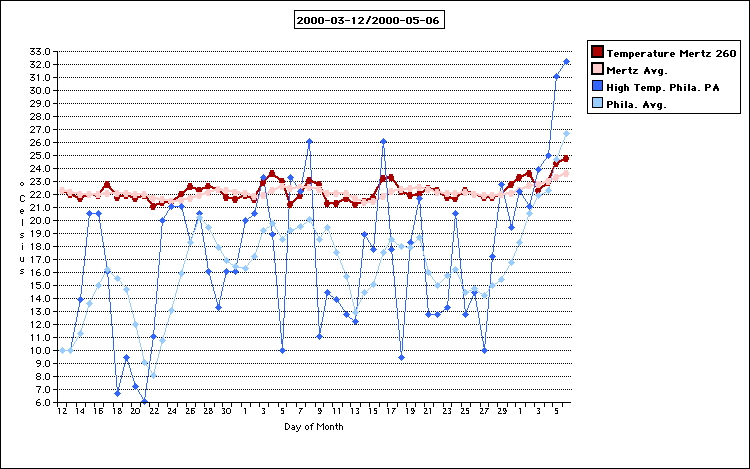
Large outdoor temperature swings had some effect on the inside environment.

Through early May, the interior average temperature varied within a small range and then rapidly increased.
| Trucksess.com |
| Family |
| Maps |
| Photo Relator |
| Statistics |
| Swarthmore
• Graphs • Temperature • 1999/2000 • Journal • Schedule |
| Misc |
| Search |